What is Technical Analysis?
Technical Analysis is the forecasting of future financial price movements based on past price movements. It helps traders anticipate what is likely to happen to prices over time. It can be applicable to stocks, indices, commodities, futures or any tradable instrument where price is affected by supply and demand. Price refers to a combination of open, high, low, or close for a given security over a specific time frame.
The time frame can be based on intraday (1 minute, 5 minute, 10 minute, 15 minute, 30 mins or hourly), daily, weekly, or monthly price data and last a few hours or many years. Also, some technical analysts include volume or open interest figures with their study of price action.
Dow Theory
At the turn of the century, the Dow Theory laid the foundations for what became modern technical analysis. Dow Theory was not presented as one complete amalgamation, but rather pieced together from the writings of Charles Dow over several years.
- Price discounts everything
This theorem is similar to the strong and semi strong forms of market efficiency. Technical Analysts believe the current price fully reflects all information. Because all information is already reflected in the price, it represents the fair value, and should form basis for analysis.
The market price reflects the total knowledge of all participants, including traders, investors, portfolio managers, buy side and sell side analysts, market strategist, technical analysts, fundamental analysts and many others. It would be foolish to disagree with the price set by these people.
Technical analysis uses the information captured by the price to interpret what the market is saying with the purpose of forming a view on the future.
- Price movements are not totally random
Most technicians agree that prices trend. However, most technicians also acknowledge that there are periods when prices do not trend. If prices were always random, it would be extremely difficult to make money using technical analysis.
A technicians believes it is possible to identify a trend, invest or trade based on the trend and make money as the trend unfolds. Because Technical analysis can be applied to many different time frames, it is possible to spot both short and long term trends.
- What is more important than why
In his book The Psychology of Technical Analysis, Tony Plummer paraphrases Oscar Wilde by stating ‘A technical analyst knows the price of everything, but the value of nothing’.
Technical analysts are only concerned with two things:
- What is the current price?
- What is the history of the price movement?
The price is the end result of the battle between the forces of supply and demand and the objective of the analysis is to forecast the direction of the future price. By focusing on price and only price, technical analysis represents a direct approach.
Fundamental analysts are concerned with why the price is what it is. For technical analysts, the why portion of the equation is too broad and many times the fundamental reasons given are highly suspect.
Technical analysts believe is it best to concentrate on what and never mind why. Why did the price go up? It is simple, more demand than supply. After all, the value of any asset is only what someone is willing to pay for it.
Supply and Demand
There are many recurring patterns that help technical analysts predict future price movements. Most of these patterns revolve around the concept of supply and demand.
Support and Resistance
Support and resistance represent key junctures where the forces of supply and demand meet. In the markets, prices are driven down by excessive supply and up by excessive demand.
As demand increases, prices advance and as supply increases, prices decline. When supply and demand are equal, prices move sideways as bulls and bears slug it out for control.
Support is an area of historical buying. A break below support signals that the bears have won out over the bulls. A decline below support indicates a new willingness to sell and/or a lack of incentive to buy. When support breaks the new lows signal that sellers have reduced their expectations and are willing to sell at even lower prices. In addition, buyers could not be coerced into buying until prices declined below support or below the previous low. Once support is broken, another support level will have to be established at a lower level.
It is sometimes difficult to set exact support levels. In addition, price movements can be volatile and dip below support briefly. Sometimes it does not seem logical to consider a support level broken until the price closes well below the established support level. For this reason, some traders establish “support areas”.
Resistance is an area of historical selling. A break above resistance signals that the bulls have won out over the bears. A break above resistance shows a new willingness to buy and/or lack of incentive to sell. When resistance breaks the new highs indicate the buyers have increased their expectations and are willing to buy at even higher prices. In addition, sellers could not be coerced into selling until prices rose above resistance or above the previous high. Once resistance is broken, another resistance level will have to be established at a higher level.
Is is sometimes difficult to set exact resistance levels. In addition, price movements can be volatile and rise above resistance briefly. Sometimes it does not seem logical to consider a resistance level broken until the price closes well below the established resistance level. For this reason, traders establish “resistance areas”.
Support Can Become Resistance
Another principle stipulates that support can turn into resistance and vice versa. Once the price breaks below a support level, the broken support level can turn into resistance.
The break of support signals that the forces of supply have overcome the forces of demand. Therefore, if the price returns to this level, there is likely to be an increase in supply, and hence resistance.
The other turn of the coin is resistance turning into support. As the price advances above resistance, it signals changes in supply and demand. The breakout above resistance prices the forces of demand have overwhelmed the forces of supply. If the price returns to this level, there is likely to be an increase in demand and support will be found.
Uptrend
An uptrend line has a positive slope and is formed by connecting two or more low points. The second low must be higher than the first for the line to have a positive slope. Uptrend lines act as support and indicate that net demand (demand less supply) is increasing even as price rises.
As long as prices remain above the trend line, the uptrend is considered solid and intact. A break below the uptrend line indicates that net demand has weakened and a change in trend could be imminent.
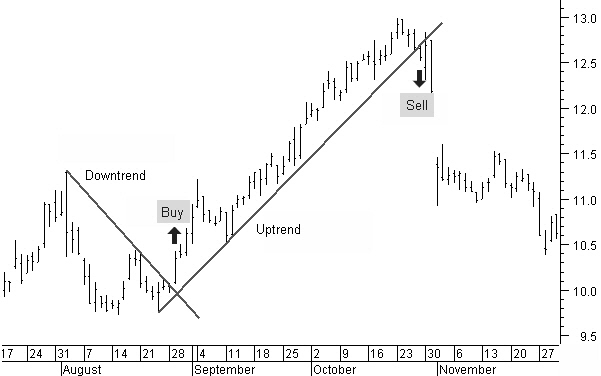
Downtrend
A downtrend line has a negative slope and is formed by connecting two or more high points. The second high must be lower than the first for the line to have a negative slope. Downtrend lines act as resistance, and indicate that net supply (supply less demand) is increasing even as price declines.
As long as prices remain below the downtrend line, the downtrend is solid and intact. A break above the downtrend indicates the net supply is decreasing and that a change of trend could be imminent.

Validation
It takes two or more points to draw a trend line. The more points used to draw the trend line, the more validity attached to the support or resistance level represented by the trend line.
It can sometimes to hard to find more than 2 points from which to construct a trend line. Sometimes the lows or highs just down matchup, and it is best to not force the issue.
Spacing
The lows used to form an uptrend line and the highs used to form a downtrend line should not be too far apart, or too close together. The most suitable distance apart will depend on the time frame, the degree of price movement, and personal preferences.
If the lows are too close together in an uptrend, the validity of the reaction low may be in question. If the lows are too far apart, the relationship between the two points could be suspect. An ideal trend line is made up of relatively evenly spaced lows.
Angles
As the steepness of a trend line increases, the validity of the support or resistance level decreases. A steep trend line results from a sharp advance or decline over a brief amount of time. The angle of the trend line created from such sharp moves is unlikely to offer a meaningful support of resistance level.
Channels
A price channel is a continuation pattern that slopes up or down and is bound by an upper and lower trend line. The upper trend line marks resistance and the lower trend line marks support.
Price channels with negative slopes (down) are considered bearish and those with positive slopes (up) bullish. The line drawn parallel to the main trend line (up or down) is called the channel line.


Flags and Pennants
Flags and Pennants are short term continuation patterns that mark a small consolidation before the previous move resumes. These patterns are usually preceded by a sharp advance or decline with heavy volume, and mark a mid point of the move.
A flag is a small rectangle pattern that slopes against the previous trend. If the previous move was up, then the flag would slope down. The price action should be contained within two parallel trend lines.
A pennant is a small symmetrical triangle that begins wide and converges as the pattern matures (like a cone). The slope is usually neutral.
The length of the flagpole can be applied to the break of the flag/pennant to estimate the advance or decline.

Symmetrical Triangle
The symmetrical triangle which can also be referred to as a coil, usually forms during a trend as a continuation pattern. The pattern contains at least two lower highs and two higher lows. That is, the next triangle is a smaller version. When these points are connected, the lines converge as they are extended and the symmetrical triangle takes shape.
To find a target the widest distance of the symmetrical triangle can be measured and extended from the breakout points.

Ascending Triangle
Because of its shape, the pattern can also be referred to as a right angle triangle. Two or more equal highs form a horizontal line at the top. Two or more rising troughs form an ascending trend line that converges on the horizontal line as it rises.
Once the breakout has happened, the price projection is found by measuring the widest distance of the pattern and applying it to the resistance breakout.
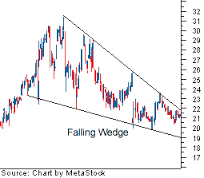
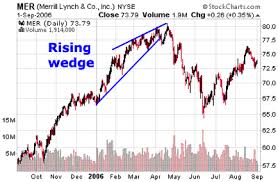
Wedges
The rising wedge is a bearish pattern that begins wide at the bottom and contracts as prices move higher and the trading range narrows. In contrast to symmetrical triangles, which have no definitive slope and no bullish or bearish bias, rising wedges definitely slope up and have a bearish bias. The opposite is true for a falling wedge.
Head and Shoulders
A head and shoulders reversal pattern forms after an uptrend and its completion marks a trend reversal. The pattern contains three successive peaks with the middle peak (head) being the highest and the two outside peaks (shoulders) being low and roughly equal. The reaction lows of each peak can be connected to form support, or a neckline.
After breaking neckline support, the projected price decline is found by measuring the distance from the neckline to the top of the head. This distance is then subtracted from the neckline to reach a price target. Since the price target is usually quite large other factors should be considered as well. These factors might include previous support levels, Fibonacci retracements, or long term moving averages.

Cup and Handle
As its name implies, there are two parts to the pattern: the cup and the handle. The cup forms after an advance and looks like a bowl or rounding bottom. As the cup is completed, a trading range develops on the right hand side and the handle is formed.
A subsequent breakout from the handle’s trading range signals a continuation of the prior advance. The projected advance after breakout can be estimated by measuring the distance from the right peak of the cup to the bottom of the cup.

Gaps
A gap is an area on the price chart in which there were no trades. Normally this happens between the close of the market on one day and the next day’s open. Gaps can offer evidence that something important has happened to the fundamentals or the psychology of the participants in the market.
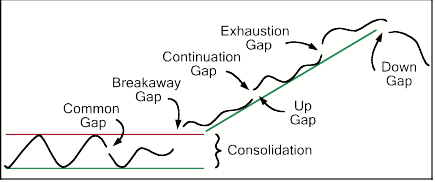
Common gap
A common gap usually appears in the middle of a trading range or congestion area, and reinforces the apparent lack of interest in the market at that time. These gaps are common and usually get filled fairly quickly.
Breakaway gap
These happen when the market is in a trading range. The market gaps through support or resistance leaving those who missed their stop loss panicking to get out and exacerbating the breakout.
Runaway gap
These gaps happen during a strong trend and if unfilled quickly show that the trend will continue. They are often called measuring gaps as some analysts theorise they show the trend is only half complete.
Exhaustion gap
These gaps happen near that end of a substantial trend. They can often be initially mistaken for runaway gaps, but when the gap is filled and reversed they show the trend is over. They should be accompanied by very high volume on the day of the gap.